
When investigating or being asked questions from people about their server load spikes or why WHM is just ‘slow’, the easiest thing for me to check is to just run a couple of the following commands and see if I can identify whats going on.
1. Top Client IPs Hitting Apache
Dump the top IPs so we can see if any are hammering apache directly or if the traffic spread is normal:
tail -n 10000 /etc/apache2/logs/access_log | awk '{print $1}' | sort | uniq -c | sort -nr | head -n 102. Top Error URLs (404, 500 & 503)
This is useful for checking for a bunch of generic vulnerabilities, exploits or probes.. given the rise of AI backed scanners, expect this to get noisy but it can reveal broken PHP scripts or other errors to restrict or fix:
tail -n 20000 /etc/apache2/logs/access_log | awk '($9 ~ /^(404|500|503)$/) {print $9, $7}' | sort | uniq -c | sort -nr | head -n 103. ModSecurity Triggers
Always have a peek at mod-sec, it’s the frontline defence of most cPanel servers (if enabled..) and it can usually give you a list of the most persistent and annoying IPs to pop straight into the firewall blocklist:
grep -i "modsecurity" /etc/apache2/logs/error_log | grep -oE "\[client [0-9.]+" | awk '{print $2}' | sort | uniq -c | sort -nr | head -n 10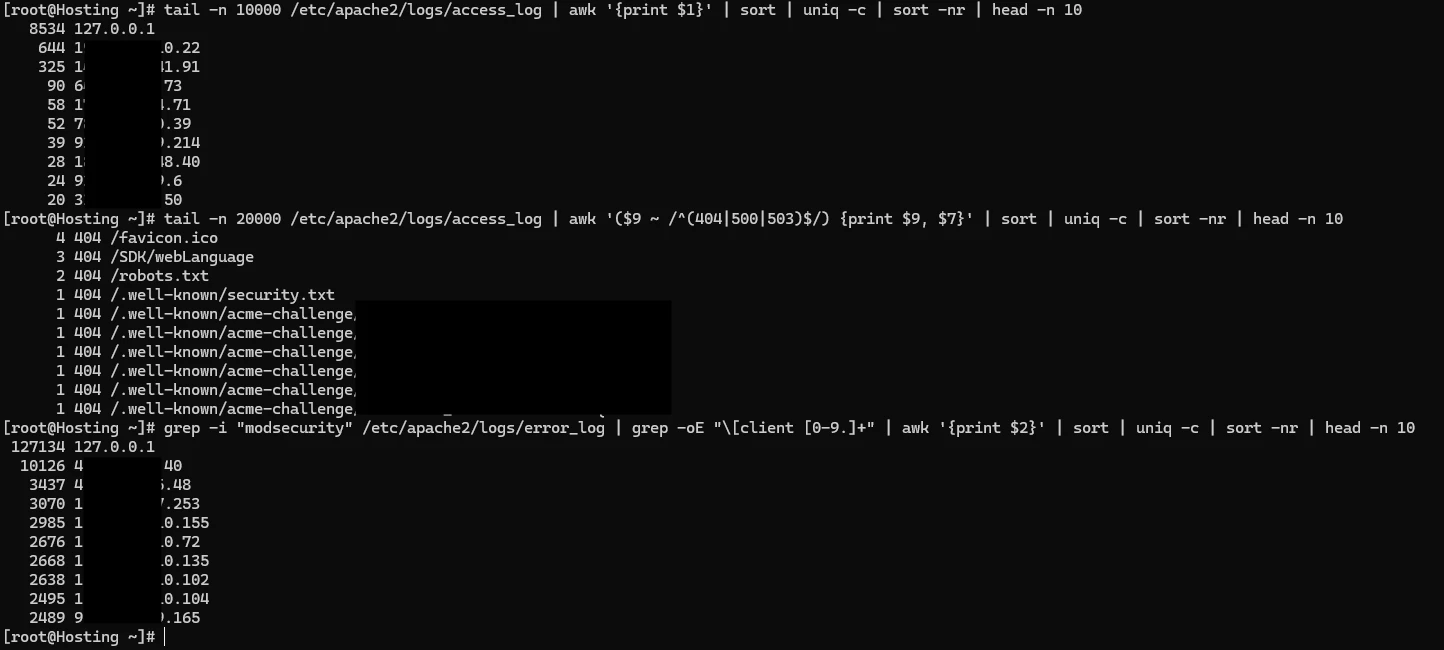
4. Active Web Sockets (Ports 80 & 443)
Quick socket check for live open connections/sockets on TCP right now against our normal webserver ports - good to ensure we aren’t maxing the worker limits or causing other mishaps:
ss -nt '( sport = :80 or sport = :443 )' | awk '{print $5}' | cut -d: -f1 | sort | uniq -c | sort -nr | head -n 10