This post quickly describes how to install Mailgraph for use with Postfix,
I needed a good way of seeing the emails sent and bounces in a quick and easy way for a customer who requested email sending of 1million emails a day, This seemed like a challenge I could get into (and did.)- Mailgraph suited my needs perfectly,
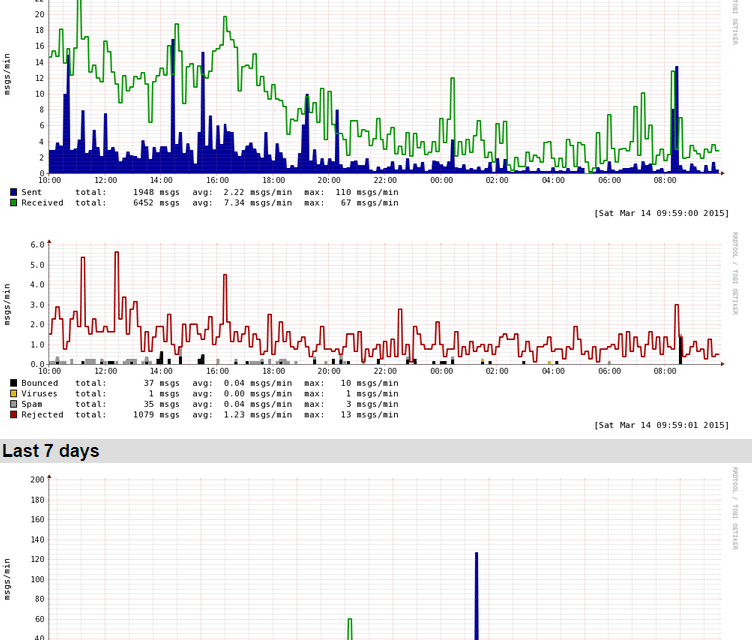
Mailgraph creates graphs for daily, weekly, monthly and yearly statistics of sent, received, bounced, and rejected emails. It also can contain spam and viruses, if SpamAssassin and ClamAV are integrated. The benefit to this system was that all these graphs can be accessed with a browser from a simple CGI script,
The system is fairly easy, it reads through your Postfix mail log and saves all the figured into a RRD database using the open source RRDTool and then the CGI shows you the pretty graphs for a quick visual indication of email throughput,
Now onto the install,
Debian –
apt-get install rrdtool mailgraph
Some questions will be prompted during the install for you to respond to,
Start Mailgraph on boot? Yes
Which Logfile? /var/log/mail.log
Remove RRD database on purge? Yes
After the installation Mailgraph gets started automatically, and an init script is installed for auto-start at boot,
Now the system is installed, compiling data and setting up our RRD database while parsing the mail log we need to see the graphs in the browser,
We need to copy the mailgraph.cgi script to the cgi-bin directory of our website
cp /usr/lib/cgi-bin/mailgraph.cgi /var/www/www.example.com/cgi-bin
You may also need to chown mailgraph.cgi to the correct owner and group, and make it executable with chmod +x
Finally direct your browser to http://www.yoursite.com/cgi-bin/mailgraph.cgi, and you will see some graphs.